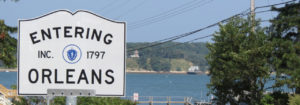
The Orleans market shares many of the same characteristics of the overall Barnstable County market. Most notable is the historically low 69 single-family homes on the market. Compared to 2015, 2016 had 16% less homes on the market year over year. By contrast, there were 5% more homes that sold over the same time period. Typically this would predict an upward pressure on pricing given the low supply and steady demand. However, the average sale price was down 6% in 2016 vs. 2015.
The table below illustrates the current spread of market activity by price point.
| Price (in $1000’s) | Active | Under Contract | Sold (2016) |
| $0-$500 | 12 | 6 | 50 |
| $501-$750 | 14 | 6 | 36 |
| $751-$1000 | 14 | 6 | 16 |
| $1001-$1500 | 7 | 1 | 21 |
| $1501-$2000 | 9 | 0 | 8 |
| $2001-$2500 | 7 | 0 | 4 |
| $2501-$3000 | 4 | 0 | 0 |
| $3000 + | 5 | 1 | 2 |
General Market Commentary
Like most of the Cape, Orleans is seeing most of its real estate activity in the lower end of the market (under $1,500,000). The average amount of days on the market for Orleans in 2016 was 194 days. This represents one of the longest averages in the Lower Cape. Additionally, the average difference between the original listing price and the selling price is just over 90%. So on average homes in Orleans accept an almost 10% reduction from the original listing price. The number of transactions would indicate that demand is consistent, but that buyers are taking more time and their offering strategies are more conservative.

